How to Measure Labor Flows?
As the concept of the labor flow networks (LFNs) is central to my PhD project, I think about measurement of these entities a lot. Labor flow networks represent the transitions of people (or flows of labor) between occupations, organizations, or geographical regions. Depending on the underlying sample, these networks can be representative of entire national labor markets or of internal labor markets of single companies. Another representation of these networks is the contingency table, or transition matrix, as traditionally used in social mobility analysis.
In this article, I will present three different underlying data sources from which LFNs can be constructed and analyzed. In a stylized presentation, I show that the resulting LFN can be perfectly isomorphic for different data sources. If this is the case in non-stylized reality is a matter of empirical investigation.
As argued by Cheng and Park (2020), the network representation is just a new interpretation of an old measurement device. For example, occupation-to-occupation contingency tables have a long tradition in research on inter- and intra-generational social mobility. The labor flow network approach simply interprets the table as a kind of a sociomatrix and the frequencies in the table are reframed as tie weights between occupations. Voila, a network is born. This re-interpretation is not solely a methodological novelty, it also gives researchers new analytical possibilities and has already led to new and surprising discoveries about internal (MacDonald and Benton 2017) and national (Lin and Hung 2022) labor markets.
I personally first received the idea by reading a chapter in a book on sequence analysis by Benjamin Cornwell (2015). There is a chapter on sequence networks in which Cornwell analyzes daily activities of individuals. Activities connect to each other in a step-by-step fashion during the day of a single individual. Wake up, have breakfast, go to work, check emails, and so on.
Cornwell then proposes to think of these sequences for many individuals at once and investigate how single activities are connected to each other across multiple daily schedules. For example, some individuals may skip breakfast and head from “wake up” to “go to work” immediately. The activities can then be depicted as nodes in a network, because via the individual transitions from activity to activity, the activities become connected via multiple pathways. Depending on how standardized or varied daily routines are, the networks can be more or less fragmented, dense, and so on.
As I was working on careers and employment sequences at the time, the transition to thinking about careers networks of occupations and organizations connected via individual transitions between them seemed natural. But there are multiple possibilities of arriving at such networks.
Cross-Sectional Data
Cross-sectional information from surveys or other data generating processes can be used for the construction of LFNs. If a respondent is asked what their current job or occupation is and what their previous job or occupation was, we have a one-step sequence from job-to-job or occupation-to-occupation. If we have many such responses, we can create a transition matrix based on a set of one-step transitions. Using retrospective information on “last job held” or the like is usually unproblematic I believe, because people tend to remember relatively well what they do for work. If they have worked in the same job for 50 years and they left their last job so long ago, they may have forgotten and even if the transition was more recent, they may not recall the exact details of the jobs or the specific title. In most instances, however, the measurements will be sufficiently precise.
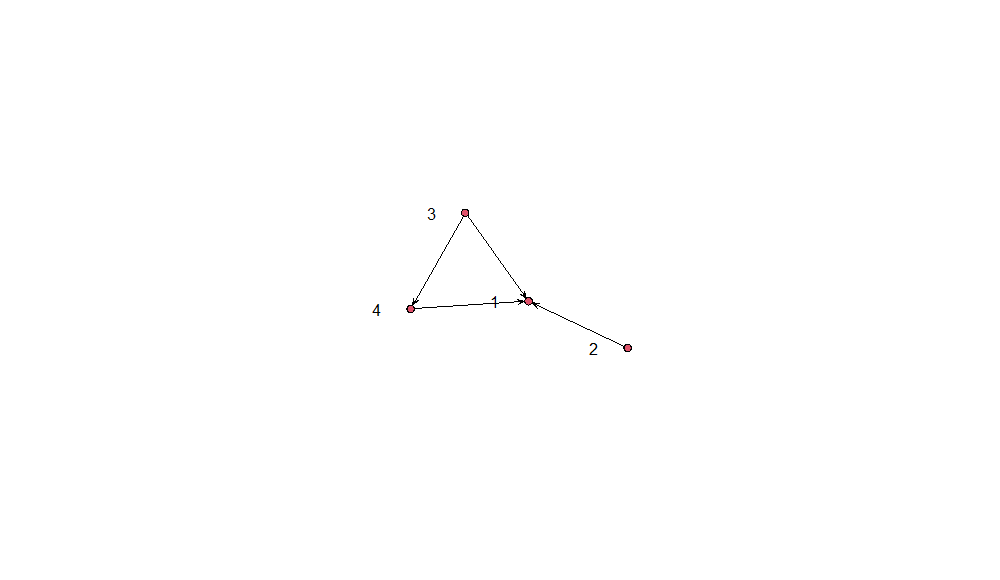
The underlying data could look like this if we have asked four people about their current and last occupation:

And the resulting LFN will look like this:

Short Panels
For longitudinal information from surveys or other data generating processes, if a respondent is asked every year (or quarter or month) what their job is, for k years. Thus we will have k job positions recorded for the person. From these k-1-step sequences, we can create transition matrices in the same fashion. An example dataset is the one used on Lin and Hung (2022).
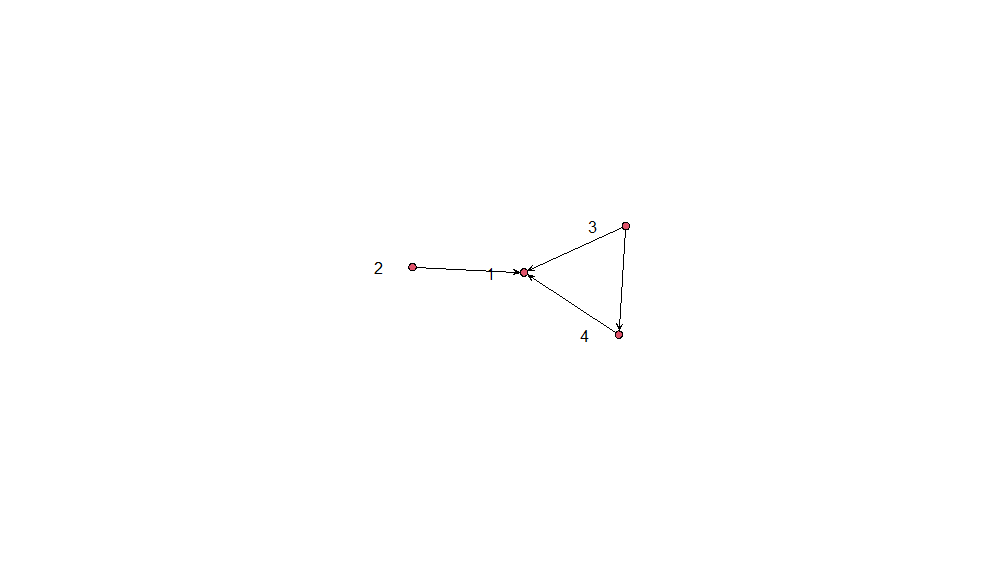
The underlying data could look like this if we have asked four people about their current occupation at two points in time:

And the resulting LFN will look like this:

Long Panels
In case respondents are surveyed from entry into the labor market (first job) until retirement (last job), we have a full sequence of all jobs they ever held available, i.e. a complete employment history (including possible spells of unemployment, self-employment, etc). This is of course rare for surveys, but often the case with register data or administrative employment data. Sometimes retrospective life-course surveys provide similarly long employment sequences. They could have been featured above, but I decided to place them here because of the similarity in sequence length. As discussed for the case of retrospective information in cross-sections, there is possible recall bias. However, administrative data are not free from bias and measurement error as well, of course.
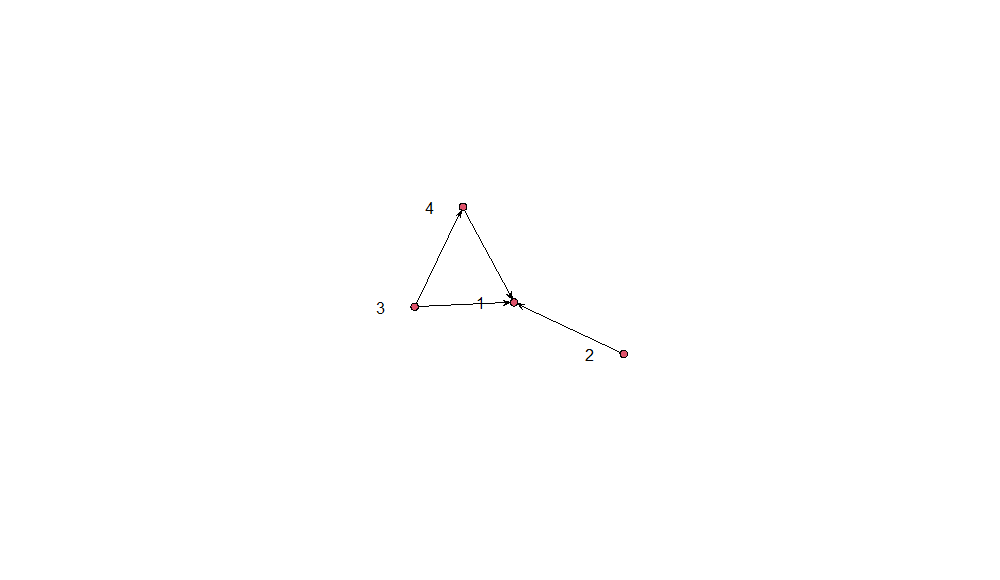
The underlying data could look like this if we have asked four people about their current at four points in time:

And the resulting LFN will look like this:

What should I use?
All data sources have their qualities of course. The beauty of cross-sectional surveys is that getting access to them is often relatively easy, whereas it is quite hard for administrative data. The prime difference I see is that longitudinal information lends itself to more than just LFN analysis. Since the networks thus constructed are based on sequence data, they may also be analyzed using sequence analysis techniques. There can be a simultaneous investigation from two analytical frameworks.
References
Cornwell, B. (2015). Social Sequence Analysis: Methods and Applications. Cambridge University Press.